
How Many People Were In The San Antonio River Basin in the Past?
One of the more difficult issues in prehistoric archaeology involves developing any reasonable estimates of population. How many people were at a site? How many people were in a region? Was this number increasing, decreasing, or was it stable at various points in the past? Answering these types of questions are especially difficult when we are dealing with groups that make a living through hunting and gathering, like the prehistoric groups in Central and South Texas, the Lower Pecos Area, and the Texas Coastal Plain. This is because these groups tend to be mobile. They live in different places for different lengths of time. Some locations are reoccupied multiple times, while others are used only once, and, in some cases, generate little or no evidence. Group size also fluctuated, as did the activities conducted at a location.
These processes create a complex archaeological record that is then degraded by factors such as erosion and bioturbation, which is the disruption of sediment, soil, and artifacts and features by plants and burrowing animals. The prehistoric record is further impacted by modern land use and construction, and damaged by artifact collecting. Archaeologists then sample a small portion of that complex, degraded record. These processes combine to make answering basic questions like “How many people were in the San Antonio River Basin?” with archaeological data all but impossible.
Recently, researchers have increasingly turned to using large-scale patterns in radiocarbon dates as an indirect measure of population size, trends in population, and occupational intensity. Building on the works of Berry (1982) and Rick (1987), researchers argue that there is a relationship between population size and the production of datable material used in radiocarbon dating. While hampered by sampling issues, temporal destruction of samples, and other biases, using large numbers of radiocarbon dates as data are still able to reveal interesting trends (e.g., Kelly et al. 2013; Shennan et al. 2013; Surovell and Brantingham 2007; Williams 2012).
Radiocarbon dates are estimates of the age of an event. When humans killed a rabbit, or built a fire with plant material, the animal or the plant no longer absorbed a form of carbon (14C) from the atmosphere. The 14C present in the wood, or the discarded bones of the rabbit, can be isolated and measured to provide an estimate of how long ago the death of the animal or the plant occurred.
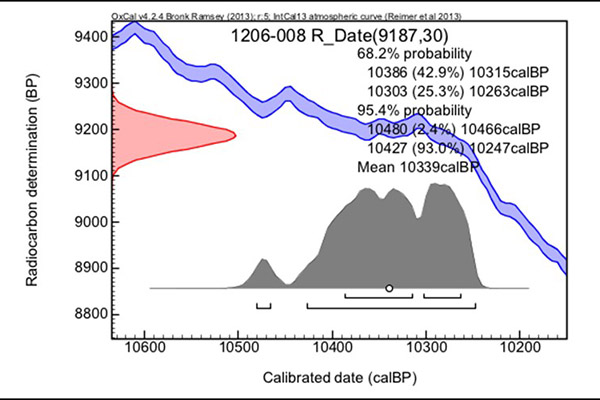
In radiocarbon dating, each event has an associated error range, shown as the pink bell curve along the Y-axis in this figure (left). When estimates of when the event happened are converted to the radiocarbon curve (blue line- which fluctuates through time) and calibrated to years before present (BP), the intersection of the estimate and the curve produce a probability estimate (gray curve). In the case above, the estimated event (9187 Radiocarbon Years +/- 30 years on the Y-axis) calibrates to two distinct calendar age ranges on the X-axis. The first is from 10480 to 10466 years BP and the second is from 10427 to 10247 years BP. Together, there is a 95.4% probability that the event occurred sometime in one of these ranges, with a 93% probability that it is within the 10427 to 10247 BP period.
Carbon Dates from the San Antonio River Basin
Using large numbers of these estimates, and summing their probabilities, we create a figure like that shown below. This figure was developed as part of CAR’s work along the Mission Reach segment of the San Antonio River in conjunction with the San Antonio River Authorities restoration of the channel in central and southern Bexar County.
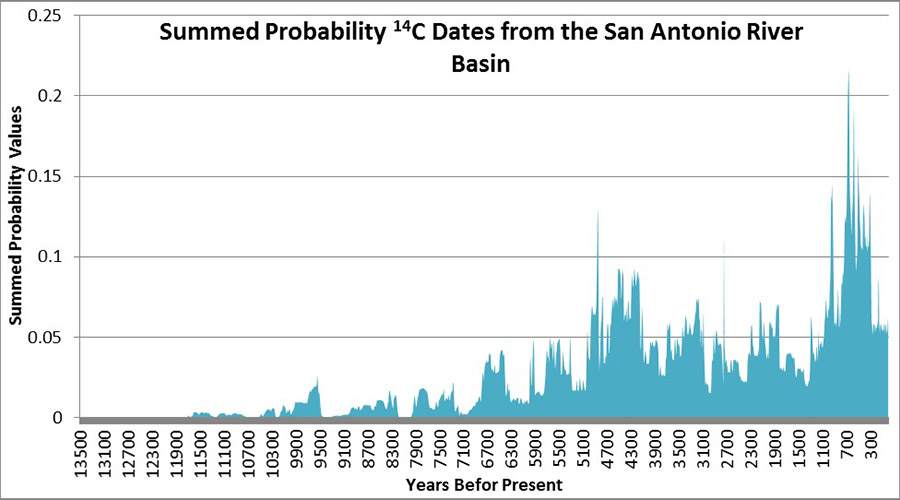
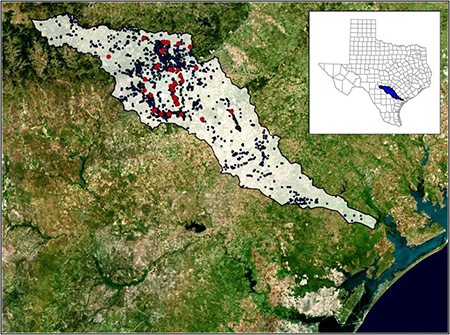
The figure above was constructed from all the radiocarbon dates we could find on charcoal and bone (n= 369) from the San Antonio River Basin, a 10,500 km2 area shown to the left. Dates are from multiple sites excavated over the last 40 years (red dots), though most dates are from Bexar County.
Looking at the radiocarbon data, the most recent period has many dates, and the earliest period has few or no dates. This is not surprising, as to some degree, the longer datable material sits in the ground, the more likely it is to deteriorate or be destroyed. Many things in archaeology have this type of falloff pattern over time. In this case, researchers have developed correction factors by comparing the frequency of radiocarbon dated volcanic eruptions with the representation of these same events in Greenland Ice Cores over the last 40,000 years(see Bryson et al. 2006; Surovell et al. 2009; Williams 2012). Earlier eruptions shown in the ice are underrepresented in dates, suggesting that they are not as well preserved. These data allow for the development of correction factors for our dates.
The figure below shows summed radiocarbon estimates like the teal distribution shown above, but with four differences. First, we grouped the probability values, shown above at 5-year bins, into 20-year intervals. We then applied the correction factor to those data, producing the pattern of data points. We then applied a 500-year running mean to the data points (red line) to smooth out short-term variations that may be created by the calibration procedures. We also truncated the distribution, showing only the 12200 through 200 BP range. This truncation reduces any impacts associated with the ends of the distribution.
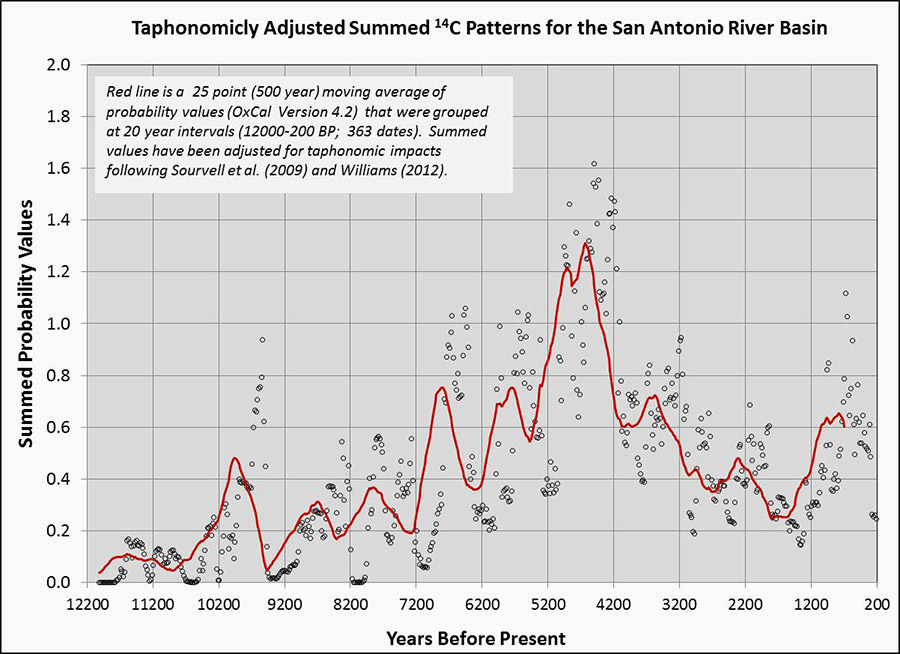
The figures shows a dramatic increase from about 10700 to 9700 BP, followed by a rapid decrease culminating around 9400 BP. There is then a fluctuating but overall increasing frequency through about 4200 BP. A dramatic and then variable decline is present over the next 3,000 years. This is followed by an increase though about 600 BP, when a decline beings though the end of the sequence.
Does the red line pattern provide a relative measure of population? It might, but we need larger samples, both more dates and more dates from beyond Bexar County, to verify the pattern. We also need to look for other explanations for the pattern rooted in elements like geomorphic exposure, undue influence of some projects, or investigator bias. At this point, all we can say is that the red line likely defines a series of temporal changes, several of which are dramatic, and all of which require subsequent investigation.
We can now ask questions about the relationship between the red line pattern and other data. Do these periods of increase or decrease correlate with climate shifts? Do they correlate with suspected shifts in subsistence or other events? The 4200 to 1400 BP dates, for example, matches closely the data range for the Late Archaic Period, a period defined by shifts in projectile point styles. Is the population declining throughout this period following a high point in the Middle Archaic? We think that most archaeologists working in the region would dispute both of these characterizations, and yet these data clearly suggest a peak at around 4000 BP and a decline following that apex. These contradictions, between what we think we know and what the archaeological patterns reveal, highlight areas that we do not understand. How many people were in the San Antonio River Basin in the past? We may never know with any degree of certainty. However, developing methods to try to answer that basic question (and others like it), applying those methods to the archaeological record, and isolating cases that do not fit, leads to improvements in both the methods we have to investigate the past, and our overall understanding of processes that happened over the last 12,000 years in Central and South Texas.
